I’ve had a chance to play with Microsoft Academic and Microsoft Academic Graph (MAG) for a while and wanted to document some baby steps here . Describing the two “services” in detail is stuff for another post, suffice it to say that Microsoft Academic is is like Google Scholar, just richer (semantic search, annotation with topics inferred with NLP techniques etc.) and MAG is the underlying data. The important point is that the MAG raw data is freely accessible via Azure, whereas Google Scholar is closed.
To get started with MAG, follow the steps on how to deploy the data on Azure storage. After that you will have roughly 500 GB of raw MAG data in your storage account. Next, set up Azure Data Lake Analytics and you’re good to go. In the following I describe how to summarize document types in MAG with U-SQL and also Azure Databricks. If you are looking for something more sophisticated, there are great tutorials on how to compute the h-index with MAG on the official website. For more examples and comparison of MAG with other offerings, have a look at this awesome list.
Count Document Types with U-SQL
U-SQL is an SQL variant developed by Microsoft that can efficiently analyze data across relational stores, including data lakes, SQL databases etc. A nice U-SQL introduction can be found here. Using the Azure portal you can submit U-SQL batch jobs that scale instantly without having to manage any infrastructure.
To submit a job that summarizes document types in MAG, simply:
- Head over to the Azure Data Lake Analytics account you just created
- Click on new job
- Give the job a name
- Copy and paste the code from this Gist
- Replace
blobAccountanddataVersionvalues with your account details - Change AU to, say, 2 (see here for details on AUs)
- Hit submit
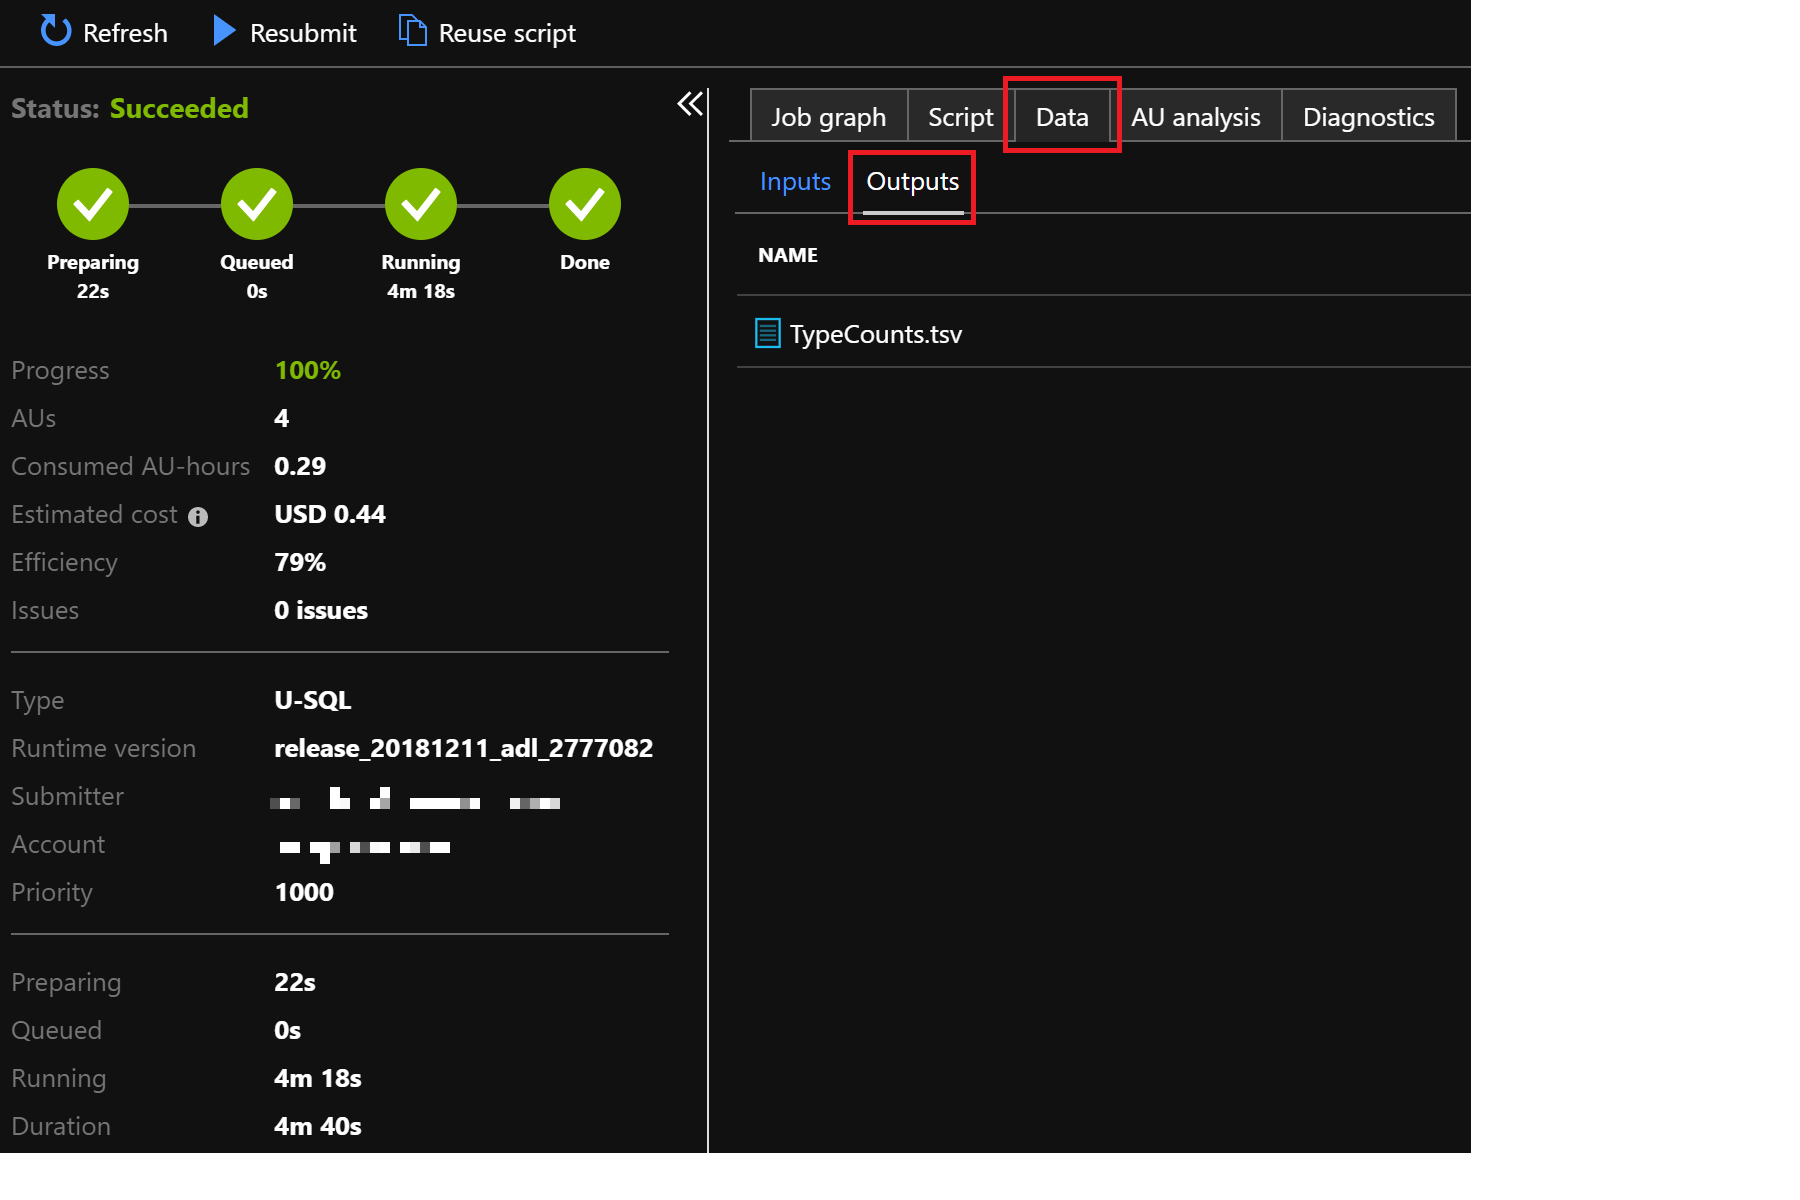
That’s it. To view the created output file, click on Data/Outputs and then the file itself (TypeCounts.csv). It will look roughly as follows:
| Type | Counts |
|---|---|
| Book | 1095185 |
| Journal | 82164726 |
| 78297141 | |
| Patent | 45486148 |
| BookChapter | 2544813 |
| Conference | 4385543 |
| Dataset | 39424 |
Count Document Types with Azure Databricks
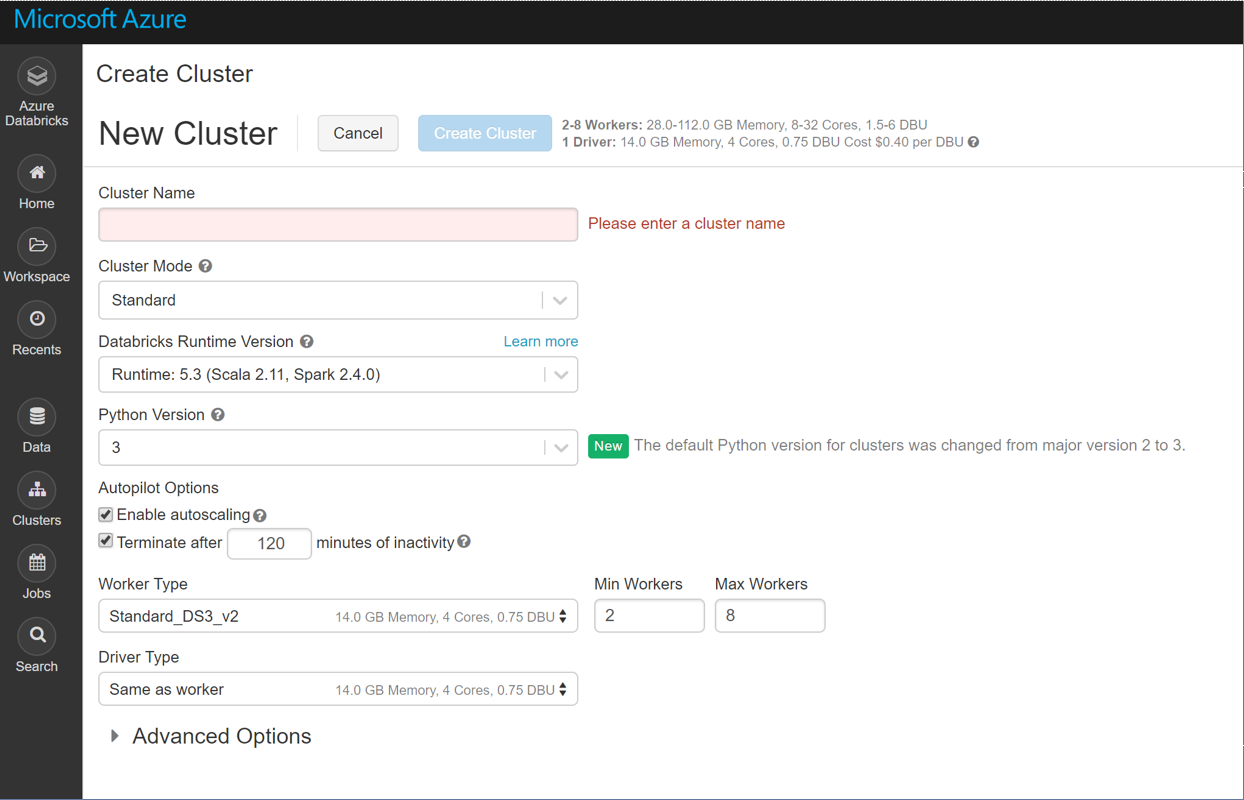
While the above is for batch jobs, you would use Azure Databricks for more interactive work on Data Lake. Azure Databricks is an Apache Spark based analytics platform optimized for Azure. It features interactive workspaces with Jupyter-style notebooks, automated Spark cluster management and effortless integration with a wide variety of data stores and services. Follow these simple steps to create a workspace and an autoscaling Spark cluster. Below is a screenshot showing how effortless the cluster creation is:
That’s really all there is to it.
With this we’ll repeat the same analysis as above just in Python/Pyspark. First, import PySparkMagClass.py (this provides a convenience class called MicrosoftAcademicGraph) into a newly created notebook (directly attached to your just created Spark cluster) and follow the steps there down to the section called
Define configuration variables
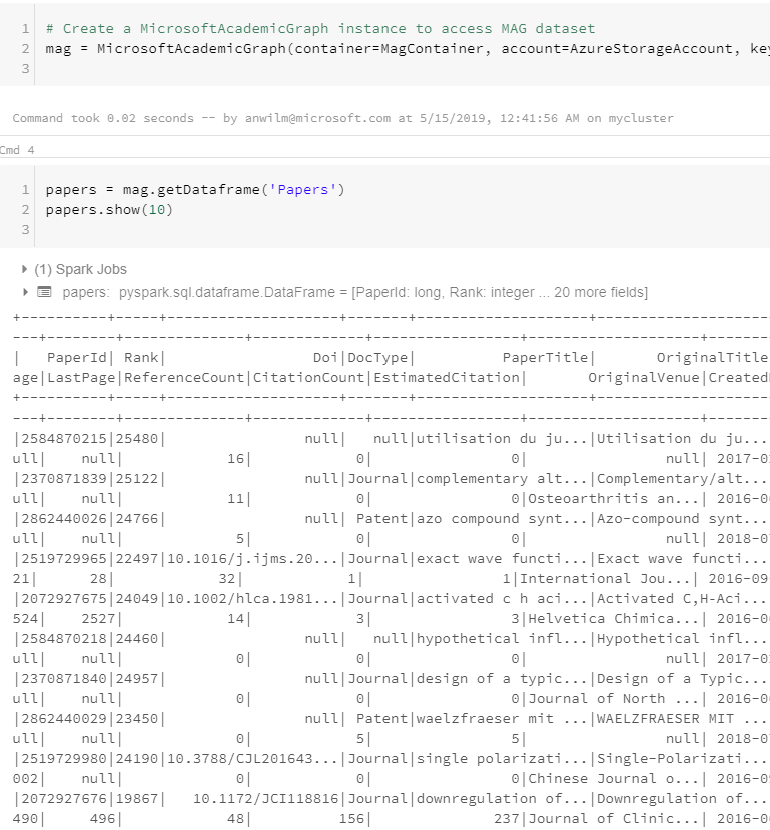
Now create a MAG instance, load the ‘Papers’ dataframe and list the first entries:
mag = MicrosoftAcademicGraph(container=MagContainer, account=AzureStorageAccount, key=AzureStorageAccessKey)
papers = mag.getDataframe('Papers')
papers.show(10)
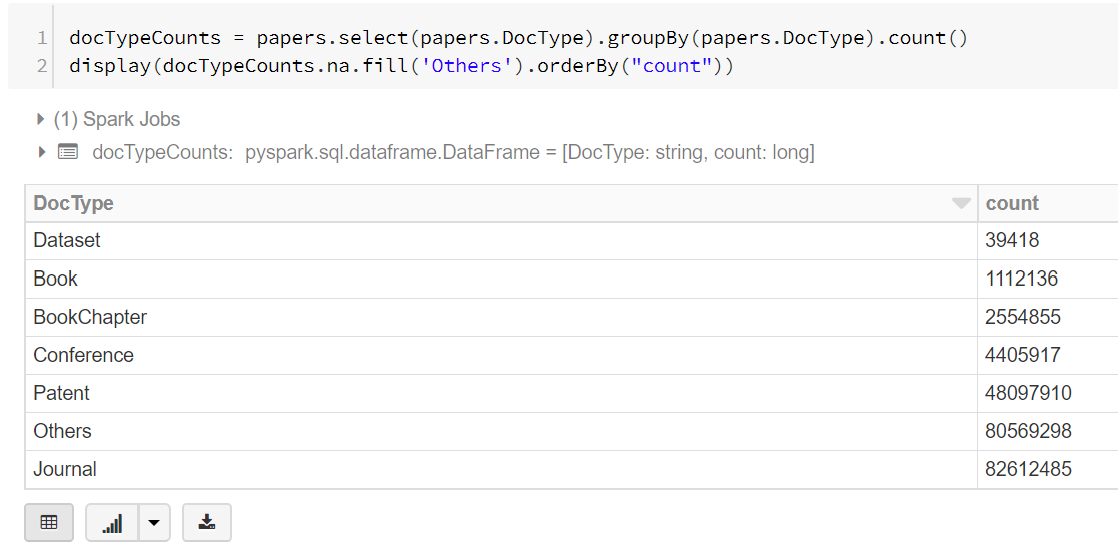
Now extract the document types:
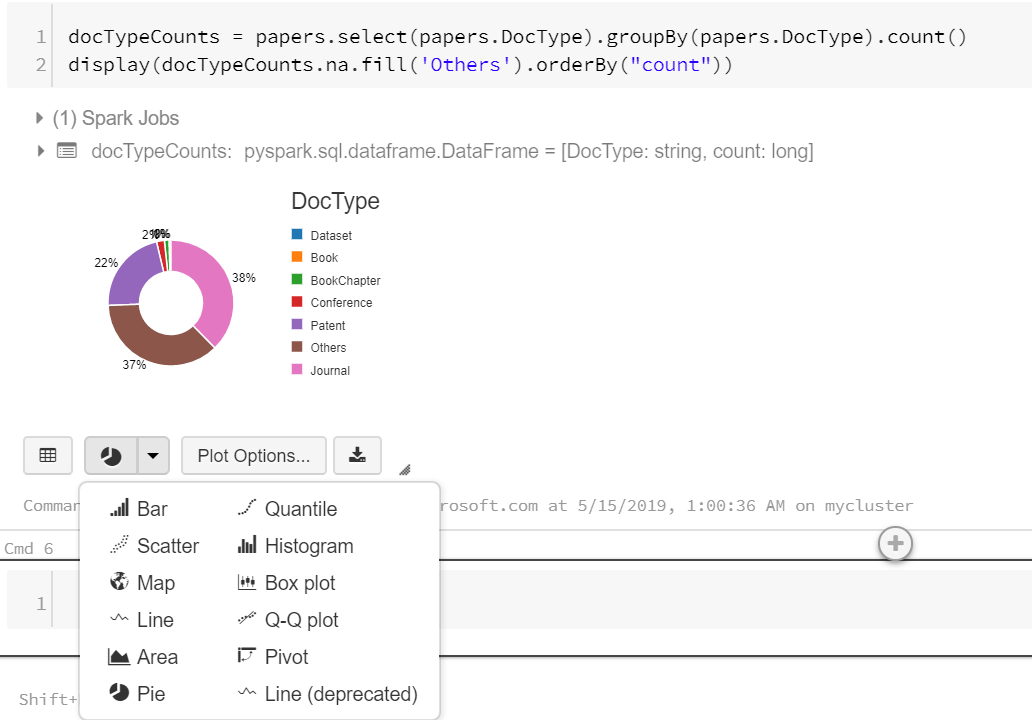
docTypeCounts = papers.select(papers.DocType).groupBy(papers.DocType).count()
display(docTypeCounts.na.fill('Others').orderBy("count"))
The data is displayed as table by default:
But the cool thing is that you can immediately convert it into a variety of plots by clicking on the plot icon (second left on bottom):
And that’s all I wanted to show.