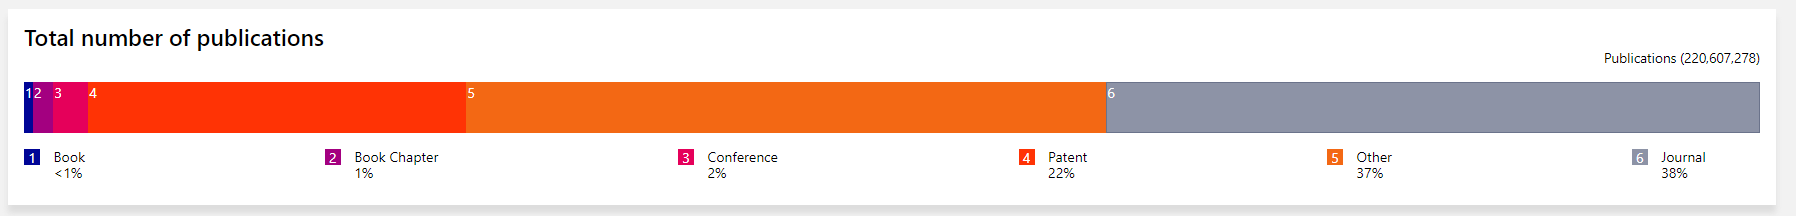
In a previous post I looked at document types in Microsoft Academic Graph (MAG), partially just to tinker with Databricks and U-SQL. Surprisingly, at least to me, a lot of documents in MAG are of unknown type. This is also plainly visible from the MAG publication website:
One speculation is that these mainly come from older documents. So let’s look at this. Using the Azure Data Lake Analytics interface, I submitted the following U-SQL job, which lists the counts for a particular combination of year and doctype.
DECLARE @dataVersion string = "your-mag-version";
DECLARE @blobAccount string = "your-blobaccount";
DECLARE @uriPrefix   string = "wasb://" + @dataVersion + "@" + @blobAccount + "/";
DECLARE @tmpOut string = "/Output/tmp.tsv";

@Papers = Papers(@uriPrefix);
@result = SELECT DocType, Year, COUNT(*) AS Count FROM @Papers GROUP BY DocType, Year;

OUTPUT @result TO @tmpOut
USING Outputters.Tsv(quoting : false);
This is not a particularly sophisticated use of Data Lake capabilities and with plain file-system access to the input data a simple awk script would have achieved the same. Anyway, I downloaded the resulting output file and plotted the results in a Jupyter notebook:
%matplotlib notebook
import matplotlib.pyplot as plt
import pandas as pd

df = pd.read_csv('Downloads/tmp.tsv', sep="\t", names=["type", "year", "count"])
Let’s first check the document types:
set(df['type'])

{'Book', 'BookChapter', 'Conference', 'Dataset', 'Journal', 'Patent', nan}
Replace NAs and count all doctypes for a final sanity check:
df['type'] = df.type.fillna('Unknown')

df.groupby('type').sum()['count']
    type
    Book            1096040
    BookChapter     2551786
    Conference      4393681
    Dataset           39418
    Journal        82367224
    Patent         48109074
    Unknown        79757454
Numbers roughly tally with the distribution above (differences are due to different MAG versions). Now let’s plot the data (using a clever pivot solution posted my MrE on Stackoverflow).
df = df.pivot(index='year', columns='type', values='count')
_ = df.plot()
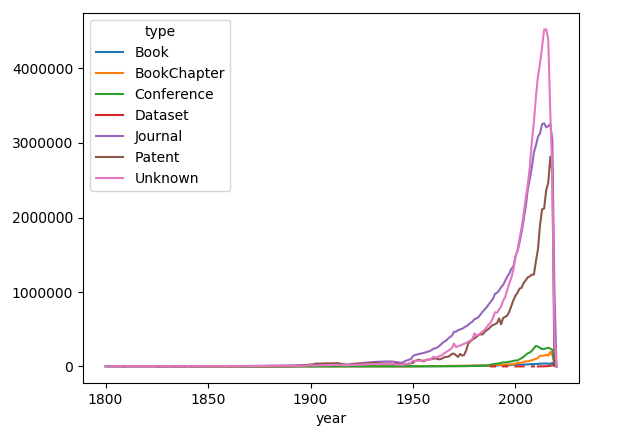
Well, that wasn’t expected: newer documents are more likely to be of unknown type. To be continued…